Break it down and it comes together
- Oct 26, 2020
- 6 min read
At Midas Touch Consulting, we nurse the market through its evolution in time. We measure the pulse and temperature in intervals. Break the market down into segments and evaluate a possible future scenario. We do this from a larger time frame perspective with inter-market relationships and fundamentals asking “hows”, “when” and “whys”. We also follow price probabilities and if our anticipated scenarios match at a future point in time with market behavior we act. Our main tools are a bi-monthly analysis, a weekly chartbook, the daily call, an intraday market snapshot followed by real-time entries and exits. We break it down and it comes together.
Here a recent example of how this works in sequence:
BTC-USDT, Hourly Chart, Sequence, break it down and it comes together:

BTC-USDT, hourly chart as of October 25th, 2020
If you look at the hourly chart above you will find the general structure of our sequencing:
P (comprehensive precious metals analysis): 10-22-2020 and
B (comprehensive Bitcoin analysis): 10-24-2020 represents the mid to long-term roadmap for possible trend direction with in-depth analysis for the “hows”, “when” and “whys”. They show the macro structure and inter-market relationships.
W (weekly crypto chartbook): 10-20-2020 and
S (weekly silver chartbook): 10-23-2020 start to zoom into possible trend setups for the mid and short term player. They try to set the near term weekly view of where prices might head. Inter market relationships point out high probability entry and exit points.
D (The daily call posted daily in our free telegram channel): is a heads up for the daily trading session on how we see the probabilities to pan out over the next 24 hours.
BTC-USDT, Hourly Chart, Zooming In:
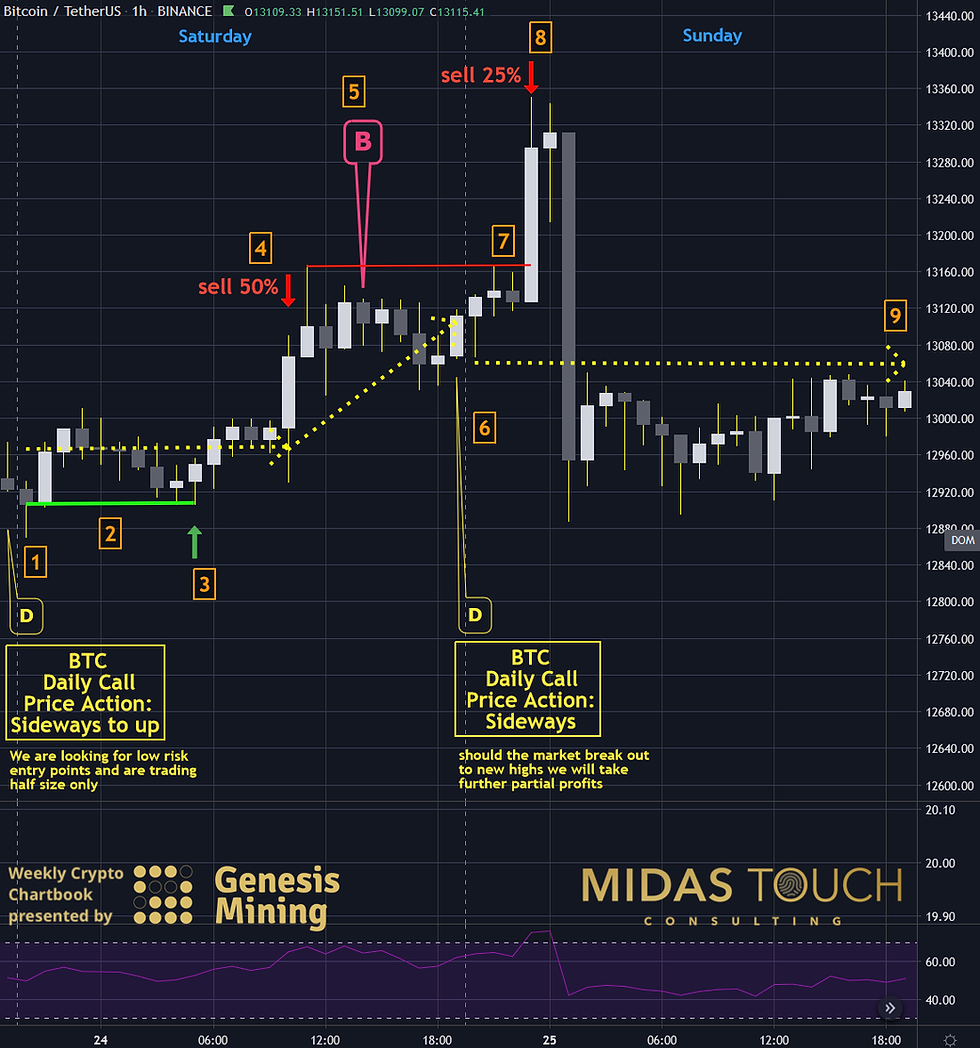
BTC-USDT, hourly chart as of October 25th, 2020 b
The main goal of the daily call is to focus the short-term trader/investor on what not to do. In our case, that was “not to short” the market. This helps to not constantly looking for entries and imagining some, where truly there aren’t any. Now zoomed in a bit, at the end of last week, on the 60-minute chart above you can see we:
1st.: placed a “daily call” in our free telegram channel to look for a low-risk long entry on half position size.
2nd.: over the next ten hours, such an entry in the form of a wide double bottom matured (green horizontal line) and.
3rd.: we had a long entry (green up arrow).
4th.: we took half of our position off to reduce risk (see our quad exit strategy).
5th.: we zoomed out of the micro view to be reminded of the larger picture releasing the comprehensive Bitcoin Analysis (B).
6th.: Sunday’s daily call was released, advising that a market breakout to new highs would most likely to be false and as such a time to take more profits.
7th.: four hours later this prediction came true.
8th.: We posted another exit in real-time right near the, later to be found out, highs of the day.
9th.: like the prior day the daily calls’ main prediction of the day’s condition came true which avoided wrong counter-trend entries and as such reducing losing trades (yellow dotted line).
BTC-USDT, Daily Chart, Right now:

BTC-USDT, daily chart as of October 26th, 2020
Zooming out to the daily time frame, it shows why we only trading half-size and are making rare, conservative plays. In this over-bought environment, low-risk entries are rare. This is rather an exit zone versus aggressive long entry market participation. We are looking for reentries near the horizontal green line price levels. It is this sequencing process of breaking complex processes down into small manageable junks of analysis from a top-down perspective that allows us to stay disciplined to not trade riskier plays even when the trend seems to provide an edge. We focus on the total picture. It comes together by seeing the market through the prismatic view. Perceiving the market in these smaller junks of stacked probability truths.
Break it down and it comes together
The common principle refers to things losing their whole once dissected and analyzed and broken into pieces. Not so in the market.
It isn’t the first time that market behavior is counterintuitive and opposite to typical rules. With variability that high this multidimensional chess requires time segment by time segment analysis and a macro and micro view at the same time. By sequencing analysis time events and measuring probabilities anticipatory, multiple goals are achieved. Segmenting takes away the overwhelm of data. It only allows anticipatory planned probabilities matching the market, hence limits data density. This allows for more conducive data reduced reactionary execution. It also avoids some of the emotional triggers that high data density in higher volume nodes and wider range and volatility typically overwhelm the novice trader.
Join our free Telegram Group :https://t.me/joinchat/HGe22hDDEEl0LvFGAgEZ9g
All published information represents the opinion and analysis of Mr Korbinian Koller & his partners, based on data available to him, at the time of writing. Mr. Koller’s opinions are his own and are not a recommendation or an offer to buy or sell securities. Mr. Koller is an independent analyst who receives no compensation of any kind from any groups, individuals or corporations. As trading and investing in any financial markets may involve serious risk of loss, Mr. Koller recommends that you consult with a qualified investment advisor, one licensed by appropriate regulatory agencies in your legal jurisdiction and do your own due diligence and research when making any kind of a transaction with financial ramifications.
Although a qualified and experienced stock market analyst, Korbinian Koller is not a Registered Securities Advisor. Therefore Mr. Koller’s opinions on the market and stocks can only be construed as a solicitation to buy and sell securities when they are subject to the prior approval and endorsement of a Registered Securities Advisor operating in accordance with the appropriate regulations in your area of jurisdiction. Past results are not necessarily indicative of future results. The passing on and reproduction of this report, analysis or information within the membership area is only legal with a written permission of the author.
Important Trading Risks and Earnings Disclaimers - Terms of Use
RISK DISCLAIMER: All forms of trading carry a high level of risk so you should only speculate with money you can afford to lose. You can lose more than your initial deposit and stake. Please ensure your chosen method matches your investment objectives, familiarize yourself with the risks involved and if necessary seek independent advice.
U.S. Government Required Disclaimer - Commodity Futures Trading Commission. Trading financial instruments of any kind including options, futures and securities have large potential rewards, but also large potential risk. You must be aware of the risks and be willing to accept them in order to invest in the options, futures and stock markets. Don't trade with money you can't afford to lose.
NFA and CTFC Required Disclaimers: Trading in the Foreign Exchange market is a challenging opportunity where above average returns are available for educated and experienced investors who are willing to take above average risk. However, before deciding to participate in Foreign Exchange (FX) trading, you should carefully consider your investment objectives, level of experience and risk appetite. Do not invest money you cannot afford to lose.
EARNINGS DISCLAIMER: EVERY EFFORT HAS BEEN MADE TO ACCURATELY REPRESENT THIS PRODUCT AND ITS POTENTIAL. THERE IS NO GUARANTEE THAT YOU WILL EARN ANY MONEY USING THE TECHNIQUES, IDEAS OR PRODUCTS PRESENTED. EXAMPLES PRESENTED ARE NOT TO BE INTERPRETED AS A PROMISE OR GUARANTEE OF EARNINGS.
CFTC RULE 4.41 - HYPOTHETICAL OR SIMULATED PERFORMANCE RESULTS HAVE CERTAIN LIMITATIONS. UNLIKE AN ACTUAL PERFORMANCE RECORD, SIMULATED RESULTS DO NOT REPRESENT ACTUAL TRADING. ALSO, SINCE THE TRADES HAVE NOT BEEN EXECUTED, THE RESULTS MAY HAVE UNDER-OR-OVER COMPENSATED FOR THE IMPACT, IF ANY, OF CERTAIN MARKET FACTORS, SUCH AS LACK OF LIQUIDITY. SIMULATED TRADING PROGRAMS IN GENERAL ARE ALSO SUBJECT TO THE FACT THAT THEY ARE DESIGNED WITH THE BENEFIT OF HINDSIGHT. NO REPRESENTATION IS BEING MADE THAN ANY ACCOUNT WILL OR IS LIKELY TO ACHIEVE PROFIT OR LOSSES SIMILAR TO THOSE SHOWN.
All information presented or any product purchased from this website is for educational and research purposes only and is not intended to provide financial advice. Any statement about profits or income, expressed or implied, does not represent a guarantee. This presentation is neither a solicitation nor an offer to Buy/Sell options, futures stocks or securities. No representation is being made that any information you receive will or is likely to achieve profits or losses similar to those discussed on this website. The past performance of any trading system or methodology is not necessarily indicative of future results. Please use common sense. Get the advice of a competent financial advisor before investing your money in any financial instrument.
Terms of Use: Your use of this educational website indicates your acceptance of these disclaimers. In addition, you agree to hold harmless the publisher and instructors personally and collectively for any losses of capital, if any, that may result from the use of the information. In other words, you must make your own decisions, be responsible for your own decisions and trade at your own risk.
Comments