And the winner is
- Oct 13, 2025
- 2 min read
Hello fellow traders, i wanted to thank PPT for having me as a guest speaker last Wednesday and thought I provide some additional charts as a follow up of me stating last Wednesday that I see a quick drop coming due to the time cycles and price behavior at the time.
I placed my first full size shorts for the first time in months as a result - one in the S&P500 index and one in Bitcoin:
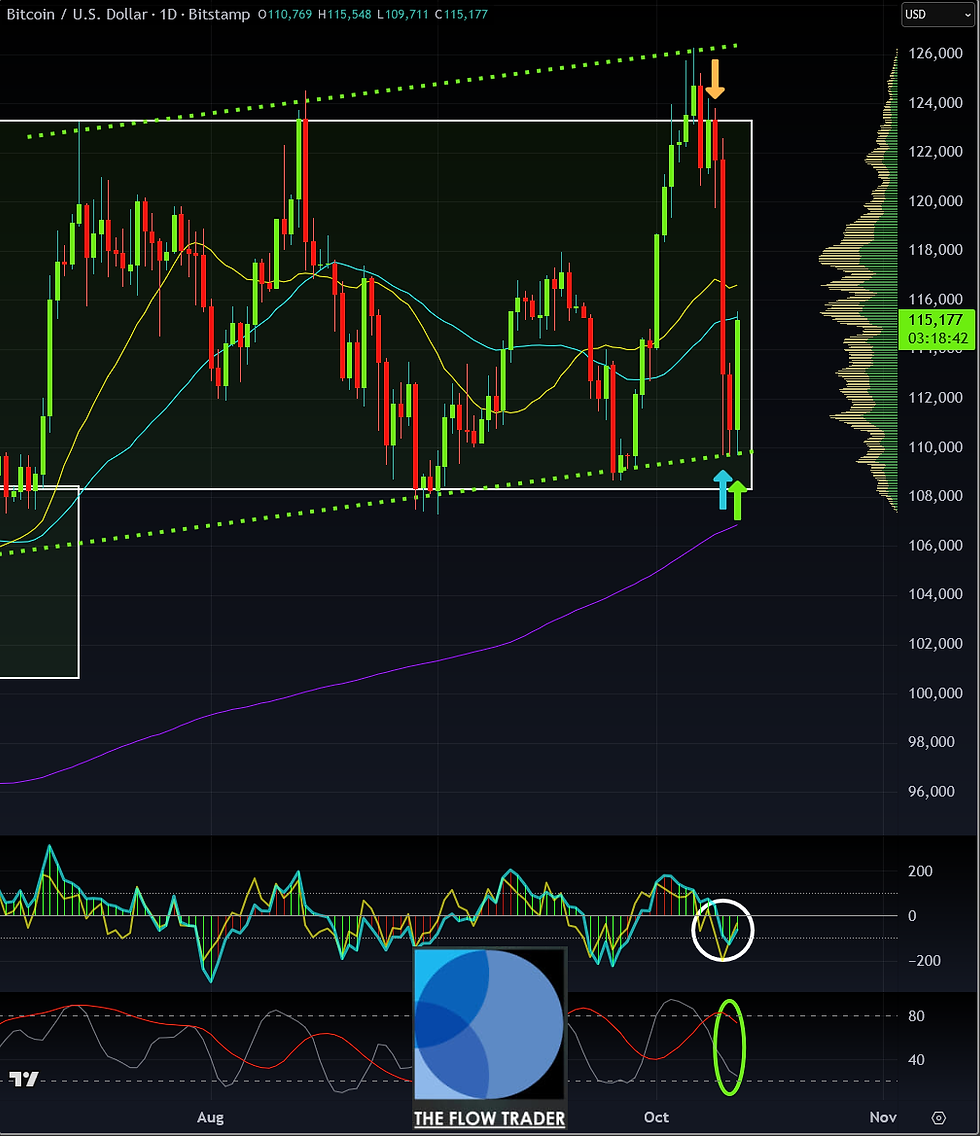
we had a strong reversal pattern and a daily call was et to short as well:

Quintuple top
action reaction
reversal time
high volume
Friday of the week/time cycle:
on the hourly chart:

for BTC the entry was already the day prior on Thursday the 9th at box top range resistance:
make a not how again the directional support is the true target-and we moved intraday so vividly that there was no warrant for taking financing at half of the range but rather at the whole range target

i took both trades on multiple time frames, financed them and am still holding the remainder 50% position size portions should we get further draw-downs- in turn-the long entries from a daily time frame perspective were even more attractive and as such I took them especially with the very low risk action/reaction principle offered by the market as well

after a pause day we had low risk entry opportunities on the 60 min chart and a confirmed entry as CEOD as well:

at the time on the setup timeframe we were also confirmed on the CCI with a ZLR and a sling pattern on the stochastic pair:
nice momentum was provided by price action and same day financing seemed suitable due to the hedge of our short exposure:

I fine tuned that with the "deep valley point of the VWAP) on the execution time frame (hourly):

even so different in size I also now have exposure with still 50% position size on the long side as a remainder of the long trades just thought you might wanted a follow up on how these "vague" predictions manifested from a trading perspective
Comments