Quarterly Debrief
- Korbinian Koller
- Jun 26, 2024
- 1 min read


ES:
what stands out most besides a strong directional pattern is volatility
historically tighter quarterly ranges are persistent up to two years consecutively in alignment to our "nothing as strong as creep" principle
wider range pushes typically have a breather or small retracement after 3 to 4 quarters

Silver:
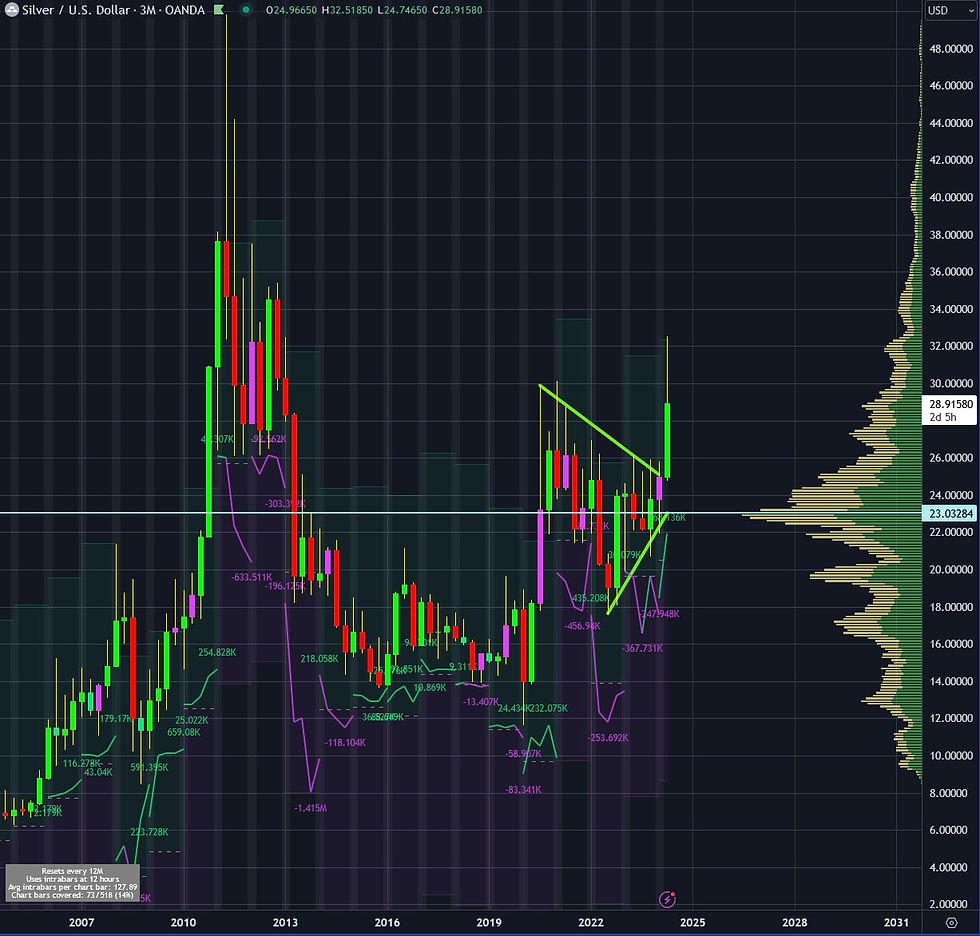
Despite the recent partly pull back this quarterly chart shows the successful triangle breakout for silver prices and a continued bullish tone

Gold:
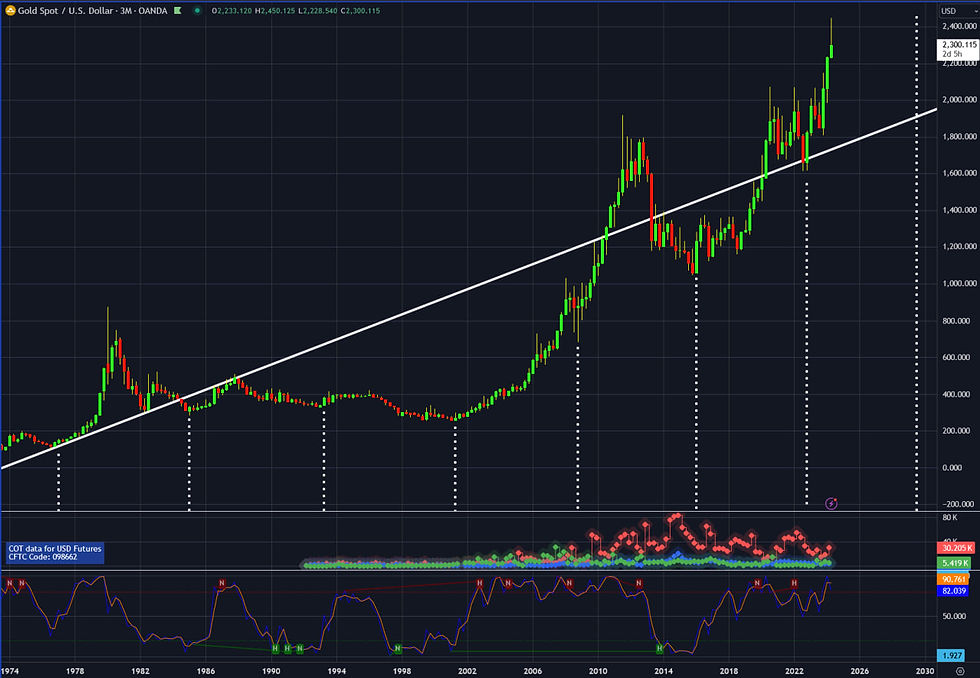
Gold might be showing its first topping formation which could result in a cooling down period of prices trading sideways and even a slight temporary retracement

BTC:
A look at this simple but telling chart you will see that a typical new high printed in bitcoin causes the next quarter to retrace 80 or 100 or even 130 percent
but this time around we haven't even reached a retracement of 50%
looking at bitcoin from this angle allows for calling it a bullish chart
Comments