The real edge
- Nov 12, 2025
- 2 min read
Common procedures:
horizontal support and resistance trading:

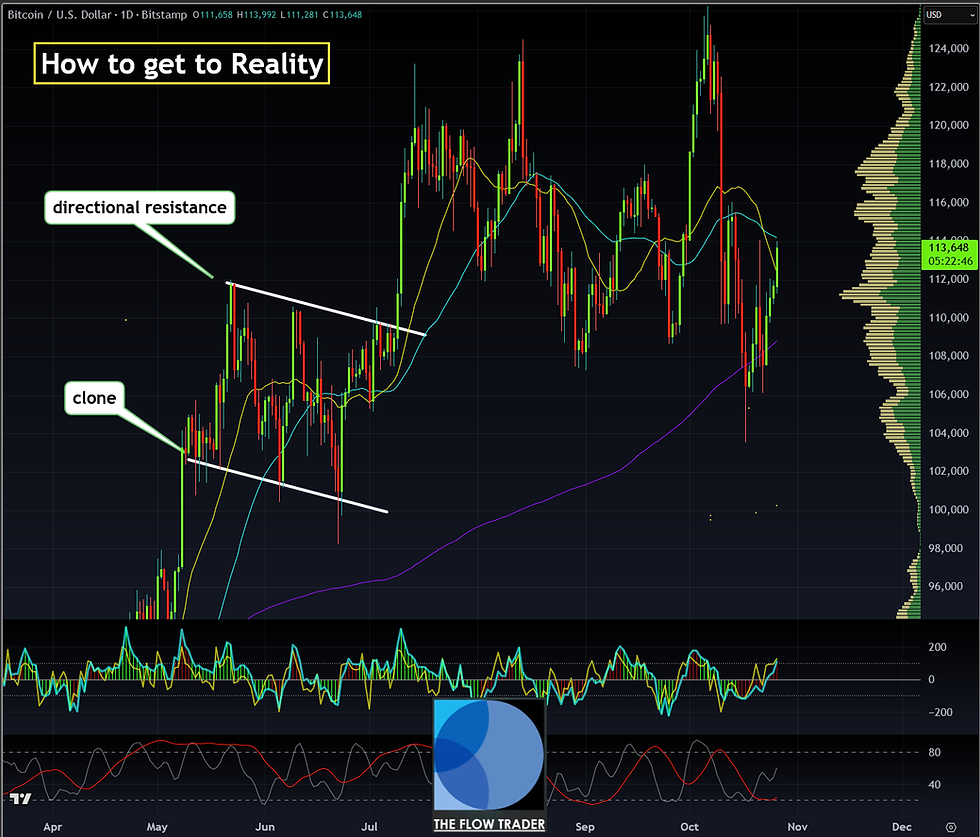
if you examine the above chart you will find no significant edge by drawing horizontal support and resistance lines on the highs and lows of this daily Bitcoin chart over the last five months. the worst part is that the drawing of these lines make the chart appear as if markets are trading sideways, while the real picture of a compression zone within a trend, gets lost. Let us look at a process that leads to the truth of how we can expose high likely turning points.

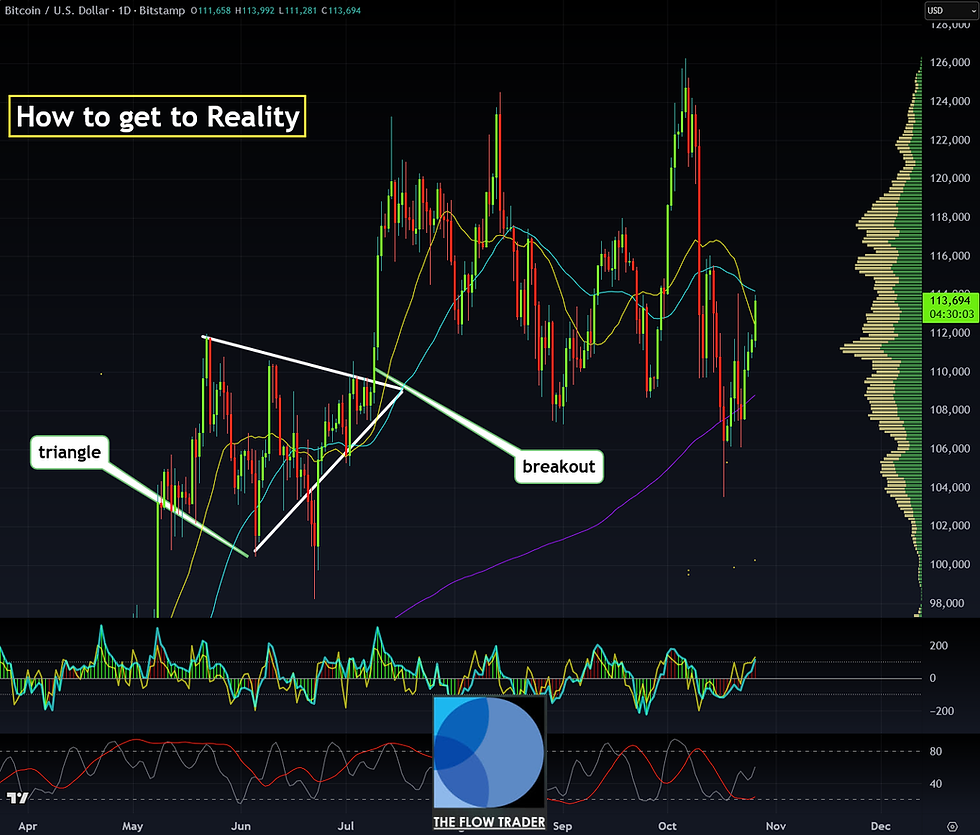
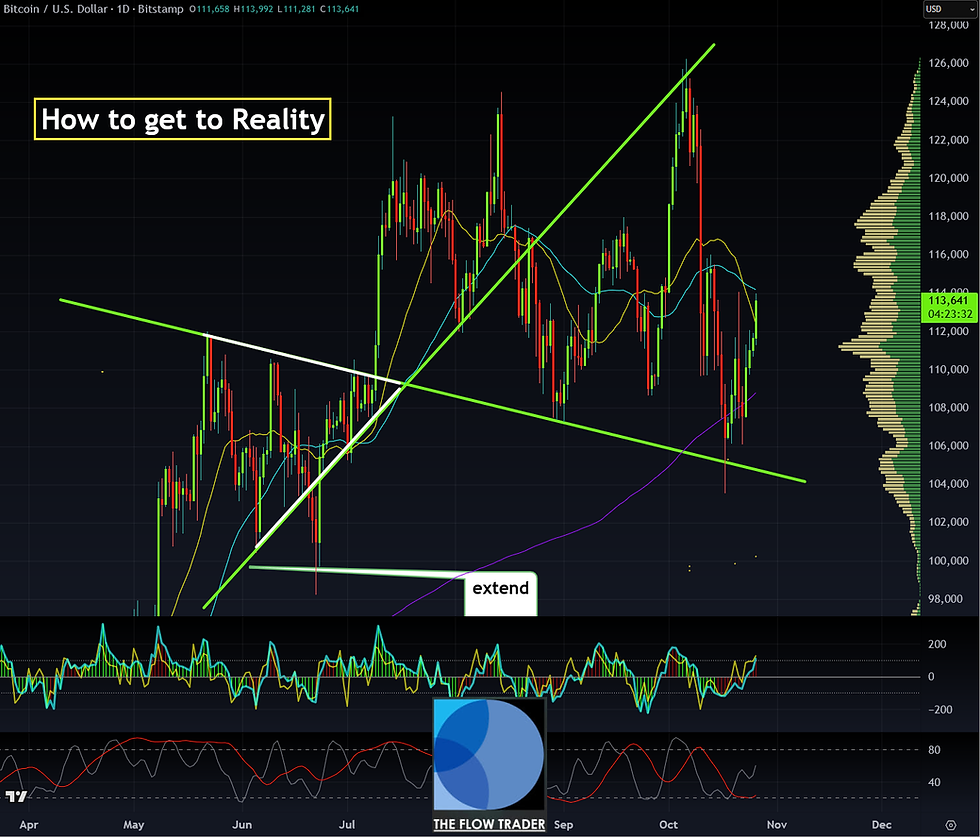
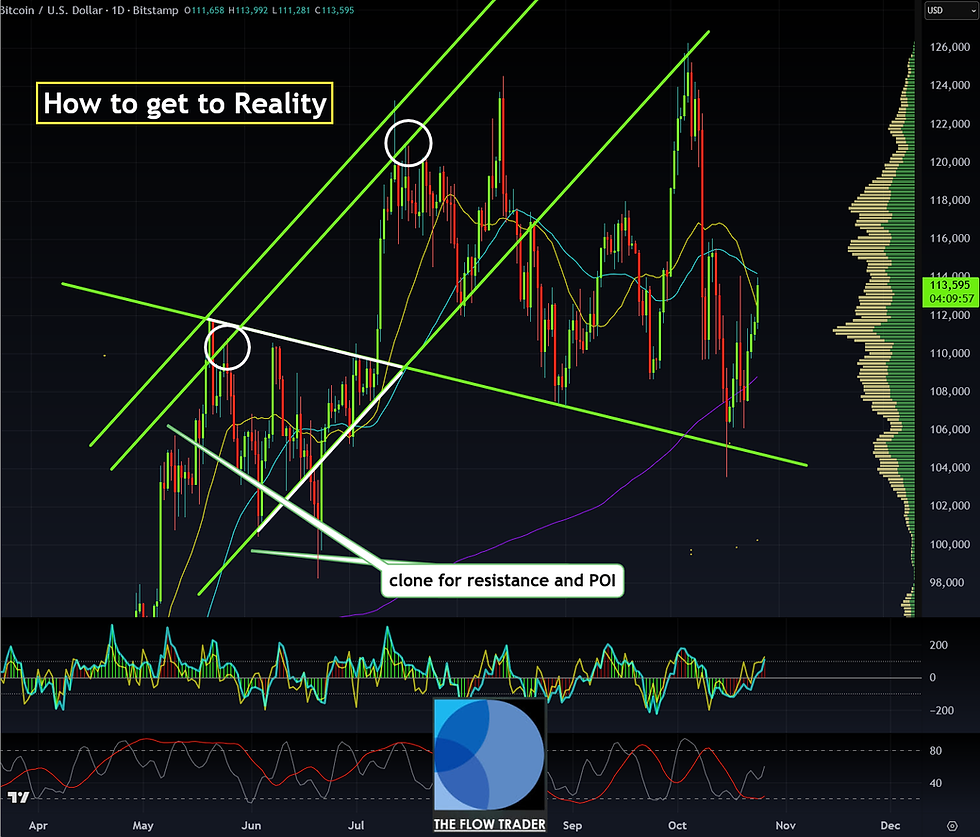
How to get to reality?


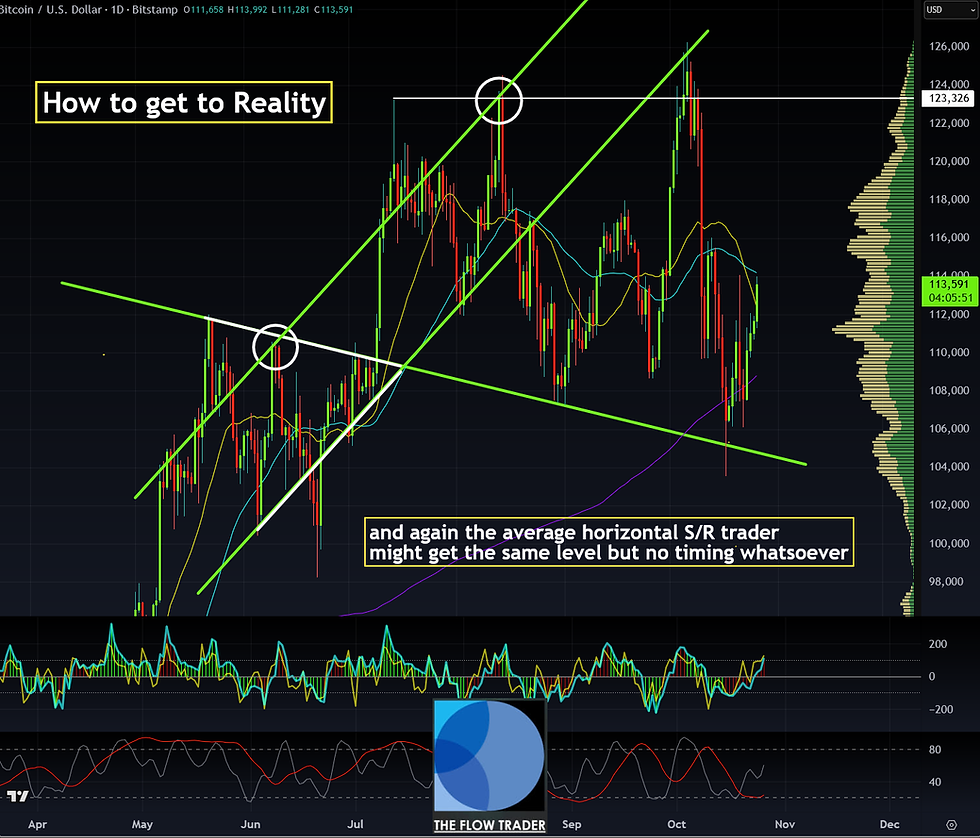


and all of this is just the beginning
because once you enter the roumes of the grid
you find ways to identify with a higher probability
the likelihoods of trend to emerge or roll over
and much much more...

quot errat demonstrandum:

:


and here is the target zone for the second exits on the BTC short reload::

let the rake(leaves)(trade) come to you...
and on and on it goes:

one of the key ideas here is to think from the end- think:which trade has potential for the runner-if that's not granted one can easier admit it if a trade is already on its way and one missed entries- that's alongside with act/react principle a definite must for entries it is a great filter to weed out subpar entries and moreover wrong direction to trade in on a day
daily call is imperative for this-do not overwrite a daily call just because it might look like you had the wrong call-most of the time the interpretations in real time are wrong and the daily call is right
to sum it up:
take the time to draw your various grids in various time frames on your various trading instruments
to expose high likely turning point probability zones to exploit low risk entry and profit taking zones:

It isn't just an option but a requirement to expand your creativity of how to create edges in a time where AI(=nothing else but a pattern recognition system) exploits market participants by finding common knowledge patterns much more efficient than a single brain What AI can't do just yet is think beyond its creators spectrum of creativity think: meshing grids of not just price based charts but time cycle grids and their overlays be the master of your domain did I mention:
I love trading
I love the market
I love the stretch to expand and grow
Comments