The sling
- Dec 1, 2022
- 2 min read
top down approach:
Principle:
oscillators are measuring momentum (=tool for sideways markets)
indicators are measuring trend (=tool for directional markets)
Now this leaves us with a problem. Markets are never black ad white but require lots of tools for the various shades of grey.
In this case, a market doesn't just trade sideways or directional. There is a zone when markets stop trending and rotate to a sideways zone.
In other words, both indicators and oscillators reach their limit and functionality at some point.
At this zone {"the sling" is most beneficial.
It is a specific pattern to be found at an indicator pair of stochastics. While working just fine as a continuation pattern like the "continuation sling," it shines in those otherwise hard-to-identify zones of price transition from directional markets to nondirectional ones.
Here are the settings and setup for the stochastics pair:
you need to import the same indicator two times.
you set one sto to:


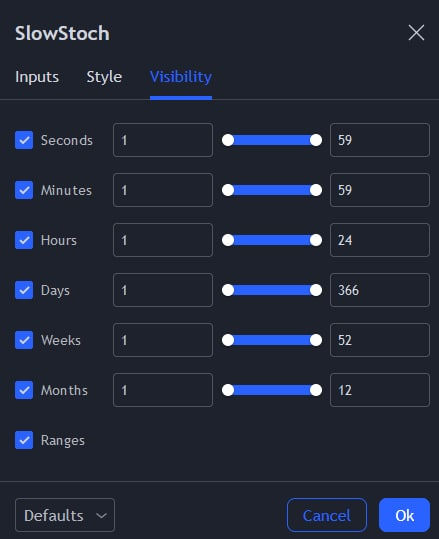
and the other one to:


the first one that is plotting in white is the fast settings
the second one in red is the slow settings
now you grab either one of the two indies with your mouse and drag the entire thing over the other indi
our outcome is the white fast line overlapping the red short setting line
like so:

Let us now walk through a few examples to identify the pattern on the stochastics pair that confirms an edge for your entry into the market:
Long entry confirmations:

(Bitcoin daily chart, courtesy of tradingview.com)
Examining the above chart at the very right, at the vertical line in time, we can see that price had retraced and built a small green indecision doji.
At the same time, you find the slow stochastics in red at or above the 80ty line, while the fast stochastics is heading south and is far away from the slow counterpart, the moment of truth.
another example for a long entry:

price retraces
uncertainty doji bar at support
slow stochastics(red) pinned up near the eighty line
fast stochastics(white) far away, and the rest is history.
As you can see in these two examples, the price is in a sideways zone, and the sling gets you confirmed into the first directional leg.
Short entry example:

As you can tell, the larger picture is once more one of a sideways zone for the price, but the sling leads you right into the breakout on very low risk for the environment changing into a directional one.
In this scenario, the price bounces one last time from support into a resistance zone of two simple moving averages(20/40 settings) and stalls into an uncertainty pattern of a small sideways doji.
At the same time, the slow stochastics(red) is pinned below the twenty reading(dotted white horizontal line). In contrast, the fast stochastic has risen sharply and confirmed a highly likely probability play.
Comments